Behind the Scenes

Author: Denis Volkov

We are completing our cruise. Soon we will reach the 18oN latitude in the Arabian Sea, do our last 124th CTD cast, and then head directly to Goa. If you have been following us throughout this journey across the western Indian Ocean from South Africa to India, by now you have learned how oceanographers strive to get data from the depth of the ocean. But this post is about those, who have stayed behind the scenes so far, but who have worked very hard to make our research cruise possible.

2018_RBrown
NOAA Research Vessel “Ronald H. Brown” in the harbor of Victoria, Seychelles

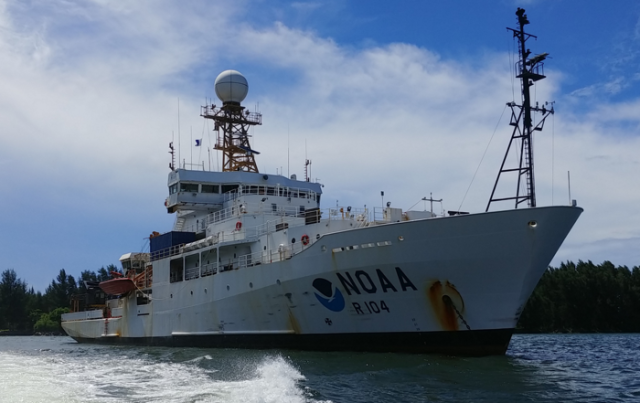
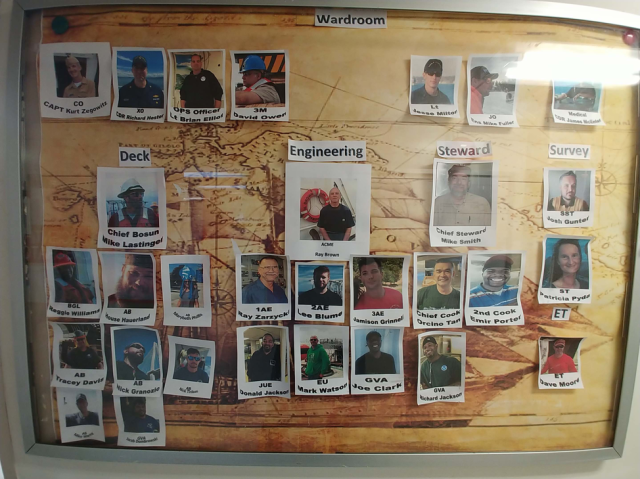
As the chief scientist of the I07N expedition, and on behalf of all scientists onboard, I would like to thank the crew of the NOAA Ship “Ronald H. Brown” for their professionalism and dedication, for paying close attention to safety and the needs of the science team, and for trying to quickly resolve problems that inevitably emerge during any oceanographic cruise.

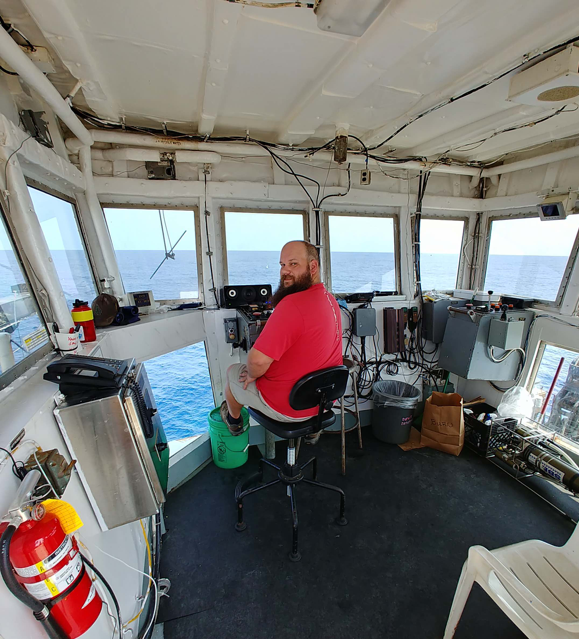
Many thanks to NOAA Corps officers for safely driving the ship across the Indian Ocean and Arabian Sea. I very much enjoyed our daily briefings and collaboration throughout the cruise.

2018_Crew
From left to right: CDR. Daniel Simon, Denis Volkov (Chief Scientist of I07N), Lt. Brian Elliot (Operations Officer), CAPT. Kurt Zegowitz (Commanding Officer), Ens. Michael Fuller, and CDR. James McEntee (Medical Officer).

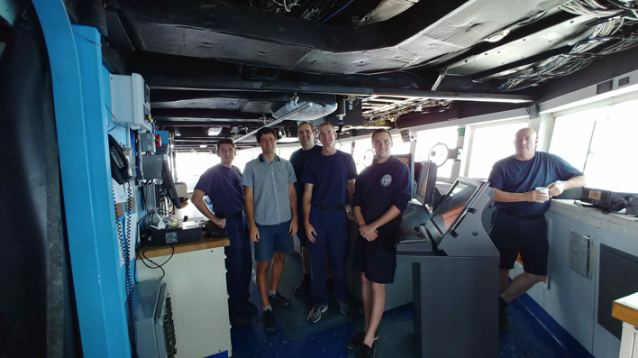
To start a CTD cast, officers on the bridge need to navigate the ship to the required location and try to keep the ship at that location. They need to account for winds, currents, and waves, and make sure that the cable with instruments in the water does not go under the ship’s hull, which may lead to the loss of the entire (and very costly!) instrument package.

2018_dingy
View from the bridge: the winch house peeking out from the ship’s superstructure in the back, the winch boom with the cable going down while the CTD is in the water.

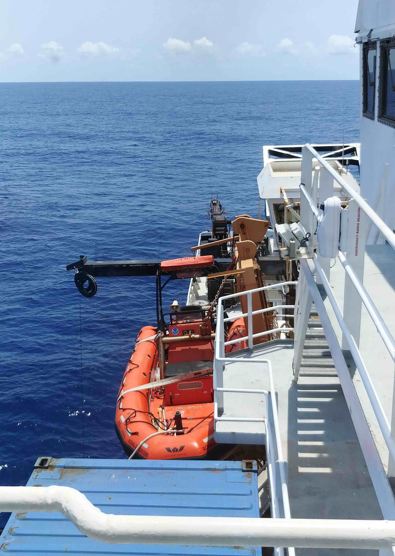
Many thanks to survey technicians onboard the Brown and the deck personnel.

2018_Gunter
Survey tech Josh Gunter ready to deploy a drifter

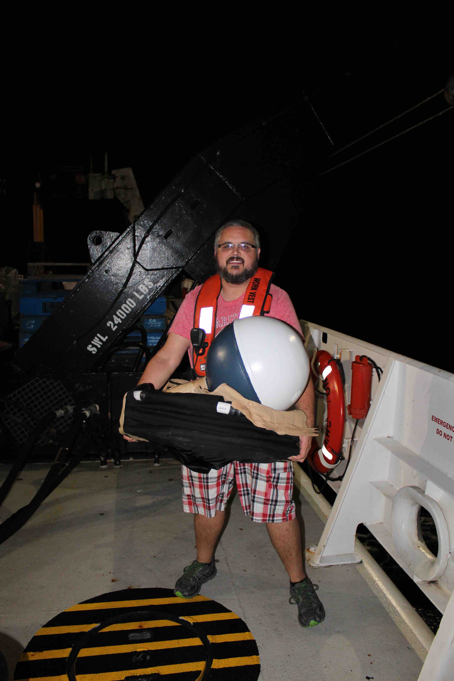
Of course, it is difficult to underestimate the hard work of winch operators. The winch operators have to spend hours, long boring hours, no matter day or night, staying vigilant and following the instructions of a CTD watch stander: “Winch down”, “Winch up”, “Winch stand-by”, “Winch stop”, “Winch up” and so forth… (you can read an earlier blog post by Yash Meghare about this).

2018_Hauerland
House Hauerland in the winch house

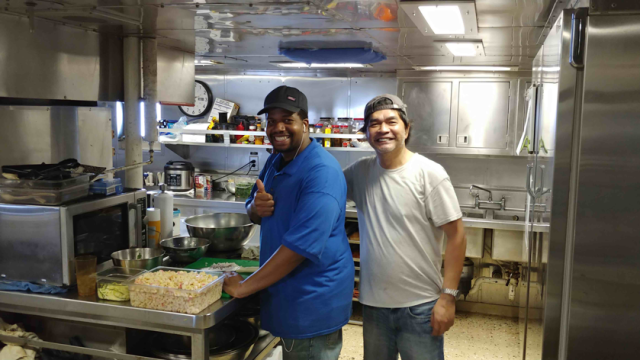
Special thanks to the galley personnel. To cook for 60 people onboard and then wash dishes is a very hard job, especially on a moving ship no matter what the sea state is. We are all grateful for delicious dishes that made the time spent in the galley as one of the most enjoyable part of the cruise (scales do not work at sea, do they? 🙂 )

2018_cooks
Cooks Emir Porter and Orcino Tan during lunch preparation

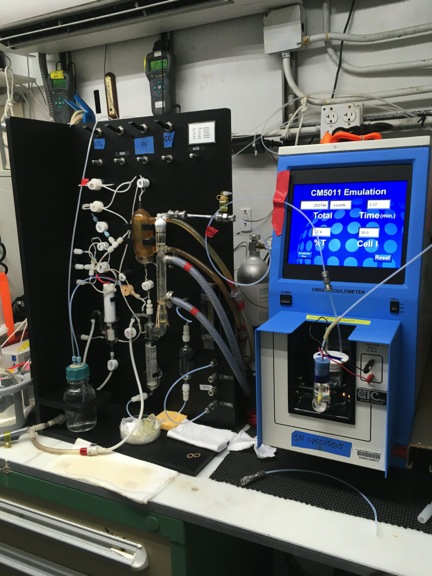
And then there are very important others. Perhaps, you would not see some of them very often, because they are on duty somewhere downstairs in the engine room, but it is largely thanks to them that the ship successfully crossed the entire Indian Ocean. If there is a technical problem that hinders science operations, it’s again them who will come and fix everything. For example, we had an air circulation issue in one of the laboratories that was causing warmer temperatures in one corner where temperature sensitive equipment was placed. Guess what? A little bit of imagination – the chief engineer’s know-how – the air flow was directed to the right place and everything was back to normal again! 🙂

Thank you all! Your hard work is very much appreciated.

2018_thankyou

A Glimpse into the DIC Lab: An Interview with Dana Greeley

Author: Kathryn Williams

The sea was angry that day, my friends – like an old man trying to send back soup in a deli. So I went to talk to Dana Greeley about DIC… Here is that “conversation”.

Kathryn: What is DIC?

Dana: DIC is an acronym that stands for Dissolved Inorganic Carbon. It is also referred to as Total CO2 (carbon dioxide). It is the sum of the dissolved carbonate species in the seas: carbon dioxide, carbonic acid, bicarbonate, and carbonate. DIC is a key parameter when making measurements related to pH and carbon dioxide flux estimates.  But do most of the readers of this blog really want to hear about this? Can’t we talk about the nice sunsets we’ve had recently? Here give them the link to DIC from Wikipedia. Then we can use your blog post to talk about something more entertaining.

Sunset
Sunset on the Indian Ocean from the NOAA Ship Ronald H. Brown

Kathryn: OK then, when did you start sailing and why do you still go out to sea to measure DIC?

Dana:  A few of my favorite literary quotes might explain my motivation: “Of all the things that drive men to sea, the most common disaster, I’ve come to learn, is women.1” But that was not the case with me. “If you really want to hear about it, the first thing you’ll probably want to know is where I was born, and what my lousy childhood was like, and how my parents were occupied and all before they had me, and all that David Copperfield kind of crap, but I don’t feel like going into it, if you want to know the truth.2” “Some years ago – never mind how long precisely – having little or no money in my purse, and nothing particular to interest me on shore, I thought I would sail about a little and see the watery part of the world.3

Kathryn: OK, alright, hold it right there! Back to the interview… How do you measure DIC?

Dana: Aarrgh, alright. But you’re going to lose your readers if we go into this full on. Send the scientists to read The Handbook and I’ll give you the layman’s version here. We collect seawater from each niskin and take those back into our 20’ shipping container that has been modified as a sea-going laboratory. Inside that lab we hook up the seawater sample to our equipment and withdraw a measured volume. That volume then drops down into a test tube shaped piece of glass (stripper) where we add a small amount of dilute acid and bubble CO2 free air through the seawater so that it resembles a nice freshly poured glass of Fresca. You know what a Fresca is don’t you Mr. Scholarship winner? The (stripped) gas from that Fresca is then sent to a cell (picture a glass beaker with side arm) which contains a blue pH reactive solution that turns clear with the addition of CO2. The cell sits in an analyzer (coulometer) which sends a light path through this (blue) solution and on the other side sits a detector which collects the light and counts the coulombs and with some additional bells and whistles we determine the total CO2 (aka DIC) within that seawater sample. You’re losing your readers here. Seriously, if you want to know more, read the Handbook.

DICE system
DICE: Dissolved Inorganic Carbon Extraction. System used by the DIC Lab to extract DIC out of water samples

Hey, did you know the captain spotted a falcon back a week ago? Turns out it was an Amur Falcon, late returning migrant to its breeding grounds.

Amur Falcon
Amur Falcon on the NOAA Ship Ronald H. Brown

Kathryn: OK, back to the interview… Why are you out here measuring DIC; what is it used for?

Dana: Knowledge is Power! More data means more knowledge which yields a greater understanding.  These GO-SHIP cruises are a continuation of the CLIVAR/WOCE lines and this repeat hydrography helps to improve our understanding of the ocean carbon cycle and how it is changing over time. Data from those previous hydrographic cruises show that the ocean is not evolving with smooth decadal trends. Therefore we need to continue to go to sea to make these carbon measurements until an Argo type float can replace us humans. The old saying still holds true, “Don’t send a buoy to do a man’s job.”  Our DIC analysis helps climate scientists study climate change and predict future climate states with different climate scenarios. Speaking of, can you believe how hot it is outside today? I wish we could package up this heat and save it for the next time someone back home says, “It’s really cold outside, they are calling it a major freeze, weeks ahead of normal!”

Any last comments?

Yes, did you know we have now crossed into the Arabian Sea? It will be interesting to see what the Oxygen Minimum Zone holds in store for us as we continue north. I expect it will be a CO2 maximum, but that’s why we come to measure.

1 Charles Johnson, Middle Passage

2 J. D. Salinger, The Catcher in the Rye

3 Herman Melville, Moby Dick

Is the Indian Ocean becoming more acidic? Measuring pH and Alkalinity to find out.

Author: Annelise Hill

Hello from day 38 of our cruise! We are all enjoying our last days at sea and looking forward to exploring India a bit and returning home.

I have been working as a pH sample analyst on this cruise for the Millero Lab at RSMAS.I came into this with no previous connections to the lab (or anyone on the cruise) and little experience sampling for pH. But now, 110 stations in, after processing pH samples 12 hours a day, 7 days a week since we left Durban, I have run 2,640 samples! So you could say that my familiarity with pH measurements has increased. In this post I will be addressing the basics of pH and alkalinity and what we can learn from our measurements.

What are pH and alkalinity?

In simple terms, pH is the scale that represents the amount of acid, or hydrogen ions, in a liquid.  Alkalinity refers to the ability of water to neutralize acid. The alkalinity value of a sample tells you how much the pH will change when acid is added. So, if you add acid to a sample with a high alkalinity the pH will lower only slightly, while a sample with a lesser alkalinity will see a larger pH decrease.

Why are we looking at pH and alkalinity?

It is super important that we measure these parameters as they tell us more about carbon cycling in the ocean. They not only tell us what the acidity and buffering capacity are, but they allow us to understand how much CO2 is mixing in the ocean. This is really important for understanding the extent of ocean acidification and how organisms might be impacted. For this cruise, where we have a dataset from 20 years ago to compare to and we measure pH at depth, we will be able to learn more about how quickly the surface layers are mixing and changing the acidity of the entire water column.

How do we measure pH and alkalinity?

We collect water samples from the full CTD cast, usually 24 samples, “fired” from discrete depths in the ocean, and this gives us a vertical profile of ocean chemistry, from the surface water to water from 4,000 meters down. To do so, we connect tubing to the niskin bottles and fill glass jars. Once we have our samples we take them inside to our lab.

If you have taken a college level intro chem course you are probably familiar with the analysis methods: we use titrations to measure alkalinity and a spectrophotometer to measure pH. But, unlike intro chemistry labs, our instruments are mostly automated.  This increases sample processing speed and there is less space for human error – you don’t have to worry about over shooting your endpoint! On the flip side, we need to incorporate info on all the chemical equilibrium systems (acid-base or not) present in the complex seawater matrix and ensure that our experimental conditions match up with theory.

For pH, we run each sample through a spectrophotometer. Spectrophotometers send light through a sample and measure how much light was absorbed by the sample. A pH sensitive dye is added to the sample, changing the color. The amount of light that is absorbed is then indicative of the pH value. The instrument compares this absorption to that of the sample without any dye added to measure the pH.

2018_PH_analysis
The instrumental setup for pH analysis

Alkalinity is measured by titration. The instrument pulls sample into a cell and then adds small increments of acid to the sample. It measures the change of pH as more and more acid is added. From this change in pH we can get the alkalinity.

2018_alkalinity_analysis
The instrumental setup for alkalinity analysis

Next steps

While we are at sea sampling and analyzing 12 hours a day 7 days a week we have very little time to take a step back and start to look at the data and what it is telling us. We have an expectation of how pH and alkalinity have changed over time, but the intricate analysis involving the whole IO7N data set will be done back on shore. It will be interesting to see the changes in ocean carbon throughout the water column since the last IO7N cruise was done. Unfortunately, my work ends when we get off the boat but it will be exciting to look at the results!

Introducing Lagrangian assets deployed during the I07N cruise

Authored by: Emily Smith

As the Ronald H. Brown continues to make its way around the world, it is also deploying many platforms that are used to observe the ocean. These platforms measure temperature, salinity, and ocean currents. Before we had these platforms, all of that information would only be collected by ships. This limited our ability to understand most of the ocean. Now we have instruments all around the world. Some of the instruments that are being deployed by NOAA’s Ship, the Ronald H. Brown are Argo floats and Drifters.   

An Argo float is a free-drifting instrument that moves up and down in the water column. It collects information from the sea surface to 2,000 meters below the surface every 10 days. Each time a float surfaces, it sends measurements of temperature, salinity, with the depth of those measurements to satellites.  

The other free floating platform that is being deployed is a global drifter. A drifter consists of a surface buoy attached by a long drogue (looks like a sock with holes in it). It gathers temperature and ocean current information that it can send to satellites. Drifter data helps us study surface circulation.

Scientists are very excited to be able to put more instruments in the water in the Indian Ocean. This is the first time in many years that measurements are being taken in this part of the world.

The Biome Beneath the Surface

Author: Victoria Coles

Inhaling and exhaling, the ocean trades gases with the atmosphere; carbon dioxide, oxygen, chlorofluorocarbons and more. Different scientists on IO7 measure each of them. But what happens to the gases away from the sea surface? In the sunlit ocean, phytoplankton busily use energy from the sun to create more oxygen gas, and to convert carbon dioxide gas to plant mass. Equally active are the bacteria and animals who devour the plants as well as each other, respiring, or turning carbon biomass back to carbon dioxide while using up oxygen. The water here all looks blue to us (Fig 1).

2019_Victoria_OceanShades
Figure 1: Different shades of blue ocean on IO7.

From one day to the next there might be more or fewer whitecaps or torrential rain or fierce sun, but the water looks the same. Below the surface however, there is a hidden world with huge variability in plants and animals. Recently, we have begun to learn that the specific types of plant and animal food webs affect how gasses are processed in the ocean. So, we expect changes in the ecology to influence how much carbon or oxygen the ocean stores, and how much it passes back to the atmosphere.

And this brings us back to how we measure the plant and animal world at and beneath the ocean’s surface.  In the Bio Lab on the ship, Hannah Morrissette (MS student at University of Maryland Center for Environmental Science) and I are working with collaborators (Greg Silsbe, Raleigh Hood, and Joaquim Goes) using funding from NASA to understand the plant and animal communities that lie at the surface where satellites can see them, as well as below where they cannot. This is Hannah’s first time at sea, and I am continually reminded of how lucky we are to be here by experiencing this adventure through her eyes. For NASA, the satellites are our eyes; they measure the wavelength of the light reflected from the sea surface, then convert this to measures of chlorophyll content that can tell us both how many plants are present (Fig 2) and how fast they are growing. These are key measures of the health and state of the ocean, used for managing fisheries (like the tuna industry here in the Indian Ocean), as well as for understanding changes in the ocean’s exhalation of oxygen and carbon dioxide.

2018_Victoria_chlorophyll
Figure 2: Ocean chlorophyll-a composite map using NOAA VIRS and NASA MODIS satellites. (Credit: Dr. Greg Silsbe)

But the satellite measurements of plankton growth must be confirmed and improved using direct measurements from a ship because the equations that convert the satellite reflectance to plankton biomass and growth depend on atmospheric conditions that are changing as well as the specific makeup of the plants that live in a region which is also changing. Here, on the Ronald H. Brown, we filter a lot of water (more than 2600 gallons so far; fig 3) to detect different pigments that each have a unique signature in the wavelengths the satellites measure. From this, we’ll improve the satellite maps to learn how the base of the food web responds to changing climate. We also continuously photograph the plankton community using a FlowCam (fig 4), and measure the size and shape of the cells as well as how they photosynthesize in response to light (using a FIRe instrument; fig 5). Each morning, we also sample the water column to learn how fast the plants and animals are growing by looking at changes in oxygen over time in sealed bottles (fig. 6). This will help us to develop estimates of how much plant based carbon sinks into the deep ocean – affecting the carbon and oxygen breath of the water when it ultimately returns to the surface.

We also tow nets in the upper ocean to learn more about the small animal or zooplankton communities that likely create the fastest source of sinking carbon to the deeper ocean. The water all looks blue, but the plants and animals have been changing radically over the different areas of the Indian Ocean (Figs 4 and 7); from the deserts of the subtropics, to the fertile tropical upwelling areas. These zooplankton samples get photographed and stored at sea for later analysis. Some animals will be examined to learn whether their shells are dissolving in waters with acidic pH. Other samples will be counted (old school) to learn who is there. Some samples will get analyzed with new genetic barcoding techniques (high tech) to find out which DNA occurs in each region. Using old and new school measurements allows us to compare this section with the last one 20 years ago while still staying up to date with modern technologies.

2018_Victoria_SmallAnimals
Figure 7: Some of the animals collected across our net tows.

As we steam through these hidden plant and animal habitats we are continually reminded of how little we know about the diverse organisms below the surface that alternately fuel and steal the ocean’s breath (Fig 7).